
In our daily life, some people are born with real senses of graphics. For my part, I did not inherit this talent, which consists in knowing how to associate colors and finding pretty patterns to make a creative and original infographic for blog content. So I have a desire to share with you a tool that has already helped me along my journey on the web to personalize my blog design! Let’s see when we should use infographics for our blog content and how to make infographics without design skills.
When to use infographics?
Overuse of infographics may lead to a loss of interest in marketing your brand, especially when your message does not have to be very detailed. However, there are several times when you can use infographics to achieve a surprising effect. Here are some of them:
To share large data sets
A large amount of data can be difficult for a reader to consume and understand. It is where statistical or informational infographic is useful. These infographics divide your data into visually appealing sections of easily readable text, data, and graphics that help people remember what they have seen for the longest time.
To tell a story
Storytelling is a crucial factor in marketing, and an infographic helps your communication with readers, both in textual and visual terms. Because of the layout of the infographic, the eye knows exactly where to go – vertically or horizontally – as if it were following the pages of a storybook. Since most people are visual learners, this flow makes the reading process much simpler and more enjoyable, improving the ability to share.
For your link building strategy
Infographics are magnificent link building and affiliate marketing tools. When contacting potential partners to get links, you can offer personalized infographics in exchange for placing links. This technique provides your partner with great content and can also lead to a lasting partnership.
To improve SEO

Many of us may forget that images can help with SEO. Although the use of keywords in blogs, web pages, and product pages is an essential component of the SERP (search page), visual aids can also help brands rank on Google.
Searching for images on Google has come a long way in recent years. With the correct alternative text, captions, and positioning, infographics can be found regardless of the ready-made content associated with them, helping your SEO.
Also, according to heat map analysis, people tend to spend more time viewing visual elements on a website than text. Using infographics in your blog content, you will ensure that people stay on your pages longer, which will be used as evidence that your pages are of a higher quality than others by Google.
How to make infographics?
I want to introduce those users like me who don’t have any design skills, an easy to use tool to make infographics quickly. It’s DesignCap Infographic Maker.
What is DesignCap?

DesignCap is precisely a very easy to use and intuitive tool with which you can either make an infographic from scratch or use one of the ready-made templates from the vast selections. You can either download your infographic as an image or share it to social media or blogs.
What’s more, you have the choice between a wide selection of shapes, photos, icons, modules, background patterns, etc. You can easily change the predefined layouts by adding text with pretty fonts, importing your visuals, applying effects to photos, and more. In short, it is a tool that has been designed for dummies in graphics!
How to use it?
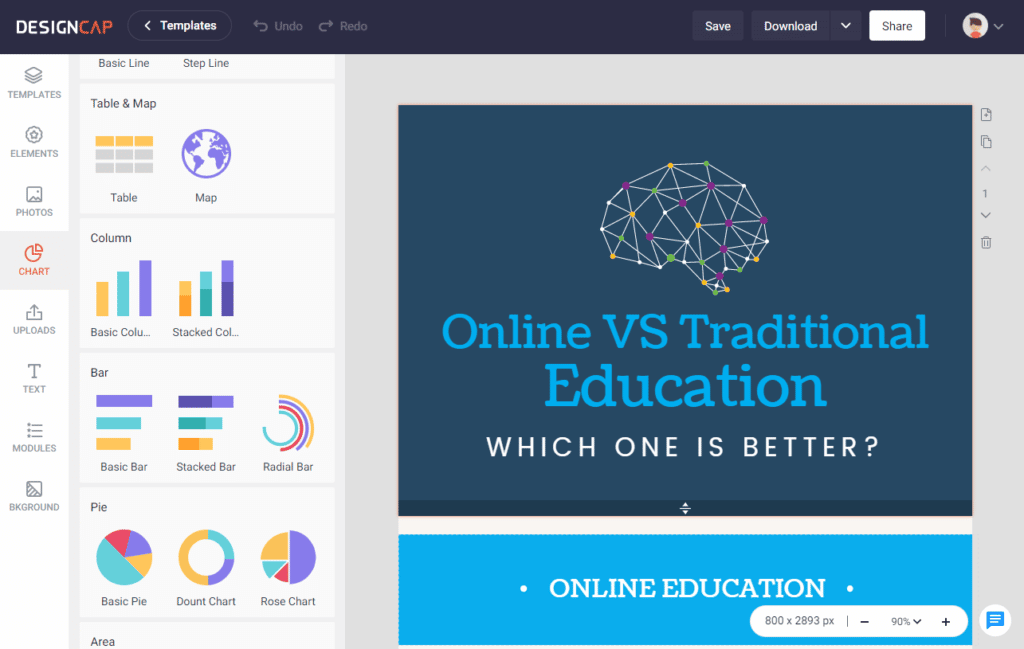
In only three steps, you can achieve your infographic in DesignCap. First, choose a template. When you are browsing in DesignCap, you will find various templates in this tool. Besides templates for infographics, there are many templates for other topics like reports, charts, presentations, YouTube channel arts, Facebook covers, etc. Pick one you like and get started. After choosing a template, it’s time to edit it to make it unique. You can add text, photos, charts and fill data to the chart by importing a file from the file format such as XLS, XLSXS, and CSV. Do other edits to adjust each element layer, position, size, color, etc. Once everything is satisfied, download your infographic as JPG, PNG, or PDF file. Or share it directly on your social media. Here we can share it in our blog post to get our blog looked appealing.
Conclusion
The way infographics display information and data makes it easy to read and attractive to the visitors, increasing the chances of the content being fully engaged and shared. With a tool like DesignCap at your disposal, you can create an infographic like a pro without much effort.